StudentShare
Contact Us
Sign In / Sign Up for FREE
Search
Go to advanced search...
Free

Financial Analysis of Solar City - Case Study Example

Cite this document
Summary
The paper "Financial Analysis of Solar City" discusses that in general, the growth of the photovoltaic industry is not only in the United States but also occurring globally. We can expect price competition among suppliers that would reduce our costs eventually…
Download full paper File format: .doc, available for editing
GRAB THE BEST PAPER97% of users find it useful
Financial Analysis of Solar City
Read Text Preview

Extract of sample "Financial Analysis of Solar City"

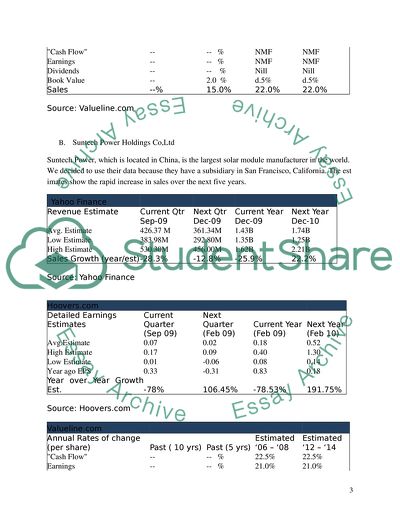
SOLAR Financial Analysis Sources of Information In conducting the analysis of Solar we used major manufacturers of photovoltaic systems tocalculate the industry’s trends and averages. We acquired financial information from financial research web sites including Yahoo Finance, Hoovers.com, and Value Line. The financial information on these websites includes estimates and recommendations made by financial analysts. A. Evergreen Solar Inc. Evergreen Solar is a relatively new company, having been founded in 1994. They specialize in manufacturing solar cells. They are based in the United States and Germany, but they have plans to expand their operations into Asia. The estimates indicate strong sales growth over the next five years. Yahoo Finance         Revenue Estimate Current Qtr Next Qtr Current Year Next Year   Dec-09 Mar-10 Dec-09 Dec-10 Avg. Estimate 74.43 M 70.95M 271.26M 352.13M Low Estimate 55.30M 37.26M 237.35M 113.35M High Estimate 87.70M 94.04M 284.10M 503.40M Sales Growth (year/est) 68.4% 27.1% 142.3% 29.8% Source: Yahoo Finance Hoovers.com         Detailed Earnings Estimates Current Quarter Next Quarter Current Year Next Year   (Feb 09) (March 10) (Feb 09) (Feb 10) Avg.Estimate -0.08 -0.07 -0.85 -0.20 High Estimate -0.03 -0.02 -0.52 0.01 Low Estimate -0.15 -0.17 -1.05 -0.62 Year ago EPS -0.13 -0.09 -0.33 -0.85 Year over Year Growth Est. 38% 18.52% -157.10% 76.95% Source: Hoovers.com Valueline.com         Annual Rates of change (per share) Past ( 10 yrs) Past (5 yrs) Estimated ‘06 – ‘08 Estimated ‘12 – ‘14 "Cash Flow" -- -- % NMF NMF Earnings -- -- % NMF NMF Dividends -- -- % Nill Nill Book Value -- 2.0 % d.5% d.5% Sales --% 15.0% 22.0% 22.0% Source: Valueline.com B. Suntech Power Holdings Co,Ltd Suntech Power, which is located in China, is the largest solar module manufacturer in the world. We decided to use their data because they have a subsidiary in San Francisco, California. The estimates show the rapid increase in sales over the next five years. Yahoo Finance         Revenue Estimate Current Qtr Next Qtr Current Year Next Year   Sep-09 Dec-09 Dec-09 Dec-10 Avg. Estimate 426.37 M 361.34M 1.43B 1.74B Low Estimate 383.98M 292.80M 1.35B 1.25B High Estimate 530.30M 456.00M 1.62B 2.21B Sales Growth (year/est) -28.3% -12.8% -25.9% 22.2% Source: Yahoo Finance Hoovers.com         Detailed Earnings Estimates Current Quarter Next Quarter Current Year Next Year   (Sep 09) (Feb 09) (Feb 09) (Feb 10) Avg.Estimate 0.07 0.02 0.18 0.52 High Estimate 0.17 0.09 0.40 1.30 Low Estimate 0.01 -0.06 0.08 0.14 Year ago EPS 0.33 -0.31 0.83 0.18 Year over Year Growth Est. -78% 106.45% -78.53% 191.75% Source: Hoovers.com Valueline.com         Annual Rates of change (per share) Past ( 10 yrs) Past (5 yrs) Estimated ‘06 – ‘08 Estimated ‘12 – ‘14 "Cash Flow" -- -- % 22.5% 22.5% Earnings -- -- % 21.0% 21.0% Dividends -- -- % Nill Nill Book Value -- -- % 18.5% 18.5% Sales --% -- % 20.0% 20.0% Source: Valueline.com C. SunPower Corporation SunPower is the leading global provider of photovoltaic systems. They manufacture and install solar cells, roof tiles, and solar panels. Their estimates also indicate strong growth in sales. Yahoo Finance         Revenue Estimate Current Qtr Next Qtr Current Year Next Year   Dec-09 Mar-10 Dec-09 Dec-10 Avg. Estimate 490.01 M 429.42M 1.47B 2.04B Low Estimate 412.00M 250.00M 1.43B 1.65B High Estimate 534.00M 566.10M 1.51B 2.41B Sales Growth (year/est) 22.2% 100.9% 2.5% 39.1% Source: Yahoo Finance Hoovers.com         Detailed Earnings Estimates Current Quarter Next Quarter Current Year Next Year   (Feb 09) (Mar 10) (Feb 09) (Feb 10) Avg.Estimate 0.34 0.24 0.73 1.35 High Estimate 0.43 0.47 0.84 1.73 Low Estimate 0.24 0.14 0.59 0.86 Year ago EPS 0.49 0.00 1.45 0.73 Year over Year Growth Est. (30)% -- % (49.98)% 85.82% Source: Hoovers.com Valueline.com         Annual Rates of change (per share) Past ( 10 yrs) Past (5 yrs) Estimated ‘06 – ‘08 Estimated ‘12 – ‘14 "Cash Flow" -- -- % 18.0% 18.0% Earnings -- -- % 19.5% 19.5% Dividends -- -- % Nill Nill Book Value -- -- % 11.5% 11.5% Sales --% -- % 22.5% 22.5% Source: Valueline.com Financial Forecasts In making financial forecasts of Solar City, we use growth estimates of major photovoltaic manufacturers including Evergreen Solar Inc., Suntech Power Holdings Co, Ltd, and Suntech Power Holdings Co, Ltd to calculate our growth rate. The estimates for 2010 and 2011 are based on financial information from Yahoo Finance. Yahoo Finance is one of the reliable research websites that provide financial information including stock exchange rates, financial reports, and financial ratios. We also use estimates from ValueLine.com for our financial forecasts of 2012 to 2014. Value Line is one of the best investment research companies that provide financial data on stocks, mutual funds, convertibles, and investment analysis. Forecasted Income Statement According to both websites, the average sales growth rate for 2010 is 30.4%, and the average sales growth of 2012 to 2014 is 21.5%. However, since we are a newly developed company, we believe that using the same percentage as major manufacturers will not be reasonable. Thus we will use a lower percentage of 5% growth rate. Based on these percentages, our pro forma monthly income statement shows an increasing trend in revenue, which records total revenue of $1,571,000 in 2010 and $3,142,000 in 2011. The highest sales will likely concentrate during summer due to the seasonality of our products. Our pro forma annual income statement for 2012 to 2014 also shows in sales and net income. 2010 Monthly Sales 2011 Monthly Sales 2010 2011 2012 2013 2014 Sales $1,571,000 $3,142,000 $3,823,050 $4,306,051 $4,852,686 Gross Profit $761,202 $1,489,413 $1,967,825 $2,257,430 $2,589,644 Net Income $161,856 $484,858 $715,715 $836,211 $985,592 Forecasted Balance Sheet Our pro forma balance sheet shows we own enough assets each year to cover our liabilities. Most of our assets consist of cash and receivables from sales of our products. Our liabilities debt remains at a low level, which indicates we will have good ability to pay off our debts and we do not require additional funding after the initial investment. Our assets increase from $1,010,074 to $3,836,650 in five years. Equity increases from $161,856 to $3,184,231 in five years. An increase in both assets and equity shows increasing value in our company. Forecast Methodology We use the percent of sales methods to determine our future sales. It is the method of using percentage of sales to prepare the pro forma income statement and balance sheet items. Our projected sales figure is based on growth rate from Yahoo! Finance and ValueLine.com. Risks to Financial Forecasts The accuracy of our projection may vary depending on future economic and industry conditions. In the best case scenario, if we experience rapid growth in our industry, we use the highest sales growth rate of our sources. Yahoo Finance estimates 39.1% growth in 2010 and Value Line estimates 22.5% growth in sales from 2011 to 2014. However, if significant economic recession and industry stagnation occur, we will use lower than our original growth rates for all five periods. Yahoo Finance         Revenue Estimate Current Qtr Next Qtr Current Year Next Year   Dec-09 Mar-10 Dec-09 Dec-10 Avg. Estimate 490.01 M 429.42M 1.47B 2.04B Low Estimate 412.00M 250.00M 1.43B 1.65B High Estimate 534.00M 566.10M 1.51B 2.41B Sales Growth (year/est) 22.2% 100.9% 2.5% 39.1% Source: Yahoo Finance Valueline.com         Annual Rates of change (per share) Past ( 10 yrs) Past (5 yrs) Estimated ‘06 – ‘08 Estimated ‘12 – ‘14 "Cash Flow" -- -- % 18.0% 18.0% Earnings -- -- % 19.5% 19.5% Dividends -- -- % Nill Nill Book Value -- -- % 11.5% 11.5% Sales --% -- % 22.5% 22.5% Source: Valueline.com Ratio Analysis 2010 2011 2012 2013 2014 Liquidity Current Ratio 2.92 2.78 3.21 4.02 5.19 Quick Ratio 2.52 2.43 2.82 3.61 4.77 Inventory Turnover Ratio 3.9 9.0 12.2 19.3 41.3 Operating Ratio 21.3% 20.8% 19.8% 19.8% 19.4% Leverage Ratios Debt to Asset 0.31 0.30 0.26 0.21 0.17 Equity to Assets 0.16 0.43 0.62 0.74 0.83 Debt to Equity 1.95 0.70 0.42 0.29 0.20 Profitability Ratios Profit Margin 10.3% 15.4% 18.7% 19.4% 20.3% Return on Assets 16.0% 32.4% 32.5% 28.3% 25.7% Return on Equity 100.0% 75.0% 52.5% 38.0% 31.0% Liquidity Ratios Liquidity ratio is one of the important ratios that investors will use. It is used to determine the ability of the company to repay its debt obligation using their assets. It is also used to determine if the company can continue as going concern. Since our pro forma balance sheet shows our assets exceed liabilities each year, we anticipate having confident numbers in our liquidity ratios. We used most common ratios in our analysis: Current ratio, and quick ratio. Current Ratio = Current Assets/Current Liabilities Current Ratio shows efficiency of the company. It measures ability to pay short-term debt with its assets. The higher the ratio, the better liquidity the company will have at being able to meet their obligation with their assets. Solar City has an increasing current ratio. In year 2012, the current ratio exceeds 3. This shows that Solar City is in very good financial health since the industry average is 2.99. Quick Ratio = (Current Assets - Inventory) / Current Liabilities Quick ratio is another popular liquidity ratio. It also measures liquidity of the company, but this ratio excludes inventory from assets to calculate the ratio. Based on our pro forma balance sheet we expect to have rising quick ratio due to improving in net sales. Since the ratio exceeds 1, we will be able to maintain good financial health. We anticipate recording the highest quick ratio of 4.77 in 2014, which is nearly twice the industry average of 2.43. Operating Ratio Operating ratio measures the efficiency of a company’s operation. The company would have better ability to generate profits if this number is smaller. Operating Ratio = Operating Expense / Net Sales Our decreasing ratio is caused by a small increase in operating expenses and rapid growth in net sales. This shows operational efficiency of our business. This number is based on the assumption that running equipment is efficient, delivery is operating efficiently, and cost of acquiring products from suppliers is reasonable. Leverage Ratios Leverage ratio measures solvency of the company. While liquidity ratio measures solvency for short-term debt, leverage ratio indicates solvency for long-term debt. Debt to Asset Ratio = Total Liabilities / Total Assets Debt to asset ratio indicates the proportion of equity and debt the company uses to finance its assets. If the ratio is greater than one, it means majority of assets are financed with debt. The ratio that less than one means that the majority of financing is provided by equity. Therefore, having a high ratio is not desirable because it indicates the company is in a risky position. Because our pro forma balance sheet shows assets increase at a greater rate than liabilities, our ratio declines and it indicates we are able to finance ourselves with our assets and equity. Profitability Ratios Profitability ratio measures a company’s ability to generate profits from its operation. Banks and other institutions that provide funding are highly concerned about this ratio because this ratio indicates the successfulness of the company. Profit Margin = Net Income / Revenue Profit margin measures how much earnings the company keeps from each dollar of sales. Our projection shows Solar City’s profit margin for 2010 is 5.3%, that means Solar City will have net income of $0.05 for each dollar of sales. The ratio of 5.3% in the first year is higher than industry average of 1.4%. An increasing trend and the ratio exceeding 15% after 2011 indicate strong profitability in our business. Valuation Analysis Choice of Valuation Formulae In order to evaluate Solar City’s business plan, the method we chose to use was Net Present Value (NPV). NPV is the popular method for company evaluation and is widely used for investment decision making. NPV involves calculating the dollar value of the projected cash flows of a specified period and compares them with a dollar value of future period. The formula of NPV is: t =time of the cash flow r = discount rate C = Net cash flow at time t Year Cash Flow PV Factor PV of CF ΣATCF 2009 -600000 1.0000 -600000 2010 44,277 0.9524 42,169 44,277 2011 189,462 0.9070 171,848 233,739 2012 431,179 0.8638 372,469 664,919 2013 614,817 0.8227 505,812 1279,736 2014 801,569 0.7835 628,050 2081,305 IRR: 39.63% NPV: 1,120,347 PI: 2.87 Net Present Value (NPV) The table above is the NPV of Solar City for the periods of 2010 through 2014. In calculating our NPV, we use a 5% discount rate. As a result, the table shows a positive NPV of $1,120,347 after Year 5. NPV indicates the expected value of an investment to a company. Positive NPV means that an investment that will be profitable. On the other hand, negative NPV means an investment will not be profitable and the project should be reconsidered. Because our PV is over 1 million, we believe this proves profitability of our project. Internal Rate of Return (IRR) Another method we used is the Internal Rate of Return. IRR is similar to the NPV. It uses the same stream of cash flows as NPV and shows rate of return from cash flows from an investment, which measures profitability of a project. However, IRR shows that the percentage and the outcome may not be always the same as NPV. It is possible that the results of NPV and IRR contradict and are misleading. Thus we use multiple methods to determine validity of both results. According to the table, Solar City’s IRR is 39.63%, showing an indication of profitability of a project. Our high IRR indicates a high return from investment relative to its cost. Profitability Index (PI) PI = PV of future cash flows / Initial investment PI identifies a relationship between the benefit and the cost of a project. A PI lower than 1.0 indicates project’s PV is less than the initial investment and, therefore, the project should be rejected. Conversely, a PI higher than 1.0 indicates PV is higher than the initial investment and the investment becomes more attractive as numbers increase. Thus, the ratio of 1.0 is the lowest acceptable level for any project. Since Solar City’s PI is 2.87 and far exceeds 1.0, it shows the attractiveness of our project. Payback Period Payback period indicates the period of time required to repay initial investments. Shorter payback period is preferred rather than longer periods. For Solar City, After Tax Cash Flow (ATCF) shows that total cash inflow exceeds initial cash outflow of $600,000 in 2013, our payback period is 3 years. According to House-Energy.com, the typical payback period for photovoltaic industry is 10 years. Therefore, we have very efficient cash inflows. Recommendation The demand for photovoltaic systems has been growing rapidly. The industry growth rate is 20%, and there is a good chance that this number will increase because of federal and state incentives and tax credits that encourage customers installing photovoltaic systems. The growth of the photovoltaic industry is not only in the United States but also occurring globally. We can expect price competition among suppliers that would reduce our costs eventually. We believe we are entering into the growing state of our industry. According to our valuation, we will have high NPV of $1,120,347 after the five-year period. Also, we have high IRR of 39.63% which indicates the significant profitability of Solar City. This is not solely as a result of a growing industry, but that our team has carefully planned our business to achieve the highest profit possible. Our short payback period is one of the benefits in our business. We require an initial investment of $600,000, but we will gain cash flows of over $600,000 after 3 years. This is due to our excellent sales projection and profit margin. Our pro forma financial statement shows strong sales increases each year. We will make sales of $1.5 million in Year 1 and the sales increase to $4.8 million in Year 5. Pro forma net income increases up to $985,592 in Year 5. Despite our future profitability, risk is another factor that we need to be concerned about. Our profitability is based on assumptions that we are able to collect customers’ payment in a timely manner. Since high portions of our sales will be on credit and our products are not affordable to every customer, we will provide consultation not only explaining the products but also discussing payment plans to mitigate potential risks. In conclusion, we are optimistic in our projection. Increasing demand and increasing trend in profitability shows Solar City will have a good chance to be in a strong position in the industry after five years. We believe timing of entering the market is optimal considering the price competition among suppliers and availability of incentive program. This strongly confirms that we recommend proceeding with the investment of $600,000 in Solar City. Read More
Cite this document
  • APA
  • MLA
  • CHICAGO
(Financial Analysis of Solar City Case Study Example | Topics and Well Written Essays - 2000 words - 1, n.d.)
Financial Analysis of Solar City Case Study Example | Topics and Well Written Essays - 2000 words - 1. Retrieved from https://studentshare.org/finance-accounting/1731423-financial-analysis
(Financial Analysis of Solar City Case Study Example | Topics and Well Written Essays - 2000 Words - 1)
Financial Analysis of Solar City Case Study Example | Topics and Well Written Essays - 2000 Words - 1. https://studentshare.org/finance-accounting/1731423-financial-analysis.
“Financial Analysis of Solar City Case Study Example | Topics and Well Written Essays - 2000 Words - 1”. https://studentshare.org/finance-accounting/1731423-financial-analysis.
  • Cited: 0 times

CHECK THESE SAMPLES OF Financial Analysis of Solar City

Loblaws Annual Report Analysis

They also have initiated solar energy projects in partnership with Northland Power Inc.... LOBLAW analysis 1.... hellip; The auditor's role is to give an unbiased opinion on the company's consolidated financial statements based on their own audits.... They had to comply with ethical requirements in order to make sure that the prepared financial statements are free from any material misstatement.... according to the auditor's opinion, the consolidated financial statements presented fairly, in all material respects, the consolidated financial position of Loblaw Companies Limited as at January 1, 2011 and were in accordance with the Canadian generally accepted accounting principles....
9 Pages (2250 words) Term Paper

A Critique on Negative Pressure Wound Therapy: Patient Perspectives

The essay analyzes the work done by Bolas and Holloway, organizing the analysis into a critique of the justification of their study, literature review, design of the study, data collection, data analysis, and the summary.... The abstract of the report clearly outlines the organization of the study as statement of the problem, the research process, and the overall findings warranting a similar structure in the analysis....
8 Pages (2000 words) Essay

Air Pollution

This paper is about the air pollution in general.... The Phenomena of acid rain and depletion of ozone layer are the consequences of air pollution.... Effective measures are needed to control the problem as it is injurious to health, lives and sustenance of the earth.... hellip; The main conflict is the air problem....
7 Pages (1750 words) Research Proposal

Base Realignment and Closure transfers

The intent of this article is to assess the economic and transportation impacts of the Base Realignment and Closure transfers on Huntsville.... The study will assist in the development of strategies which shall "anticipate and mitigate adverse impacts on transportation and other infrastructure".... hellip; The American federal government has previously attempted to promote "rail usage and guide its development"....
7 Pages (1750 words) Essay

International Business: Technology

The format that will be utilized for this assignment is to first introduce one of the seven forces of globalization and explain some of the recent trends in that particular field, followed by a kind of SWOT analysis to the international business.... The purpose of this assignment "International Business: Technology" is to provide some insight as to one of the seven forces of globalization....
7 Pages (1750 words) Essay

Financial Performance of British Petroleum plc

For such analysis, different financial ratios were calculated.... To understand the financial performance of the company, its profitability, liquidity, solvency, efficiency, and market performance throughout the last 5 years were analyzed in the "financial Performance of British Petroleum plc" paper.... t helps to determine the net profitability of the company throughout the financial year....
6 Pages (1500 words) Case Study

Defence of Globalization

ood data are the principle of a strong fruitful analysis in development and invention, for broad swaths in the developing countries.... The paper "Defence of Globalization" discusses that it is believed that the term landscape come to us in the 5th century,  it refers to a system of human-made spaces in the land such as a field with boundaries that are not necessarily defined by walls or fence....
5 Pages (1250 words) Essay

Powers and Responsibilities of the GLA and the Mayor

In the paper “Powers and Responsibilities of the GLA and the Mayor” the author discusses the powers over the local authorities of Greater London, which are similar or equal to those given to the city of London Corporation, and the same as those of the local authorities in the boroughs of London.... The first of these is that he has to come up with strategies, which are aimed at ensuring that the entire city is moving in the right direction and that these strategies have been implemented correctly....
10 Pages (2500 words) Essay
sponsored ads
We use cookies to create the best experience for you. Keep on browsing if you are OK with that, or find out how to manage cookies.
Contact Us